Workflows, models, and runs
Models and providers
The model registry is the source of truth for every model Maestro can route to. It supports any number of entries and remains searchable and filterable for large registries.
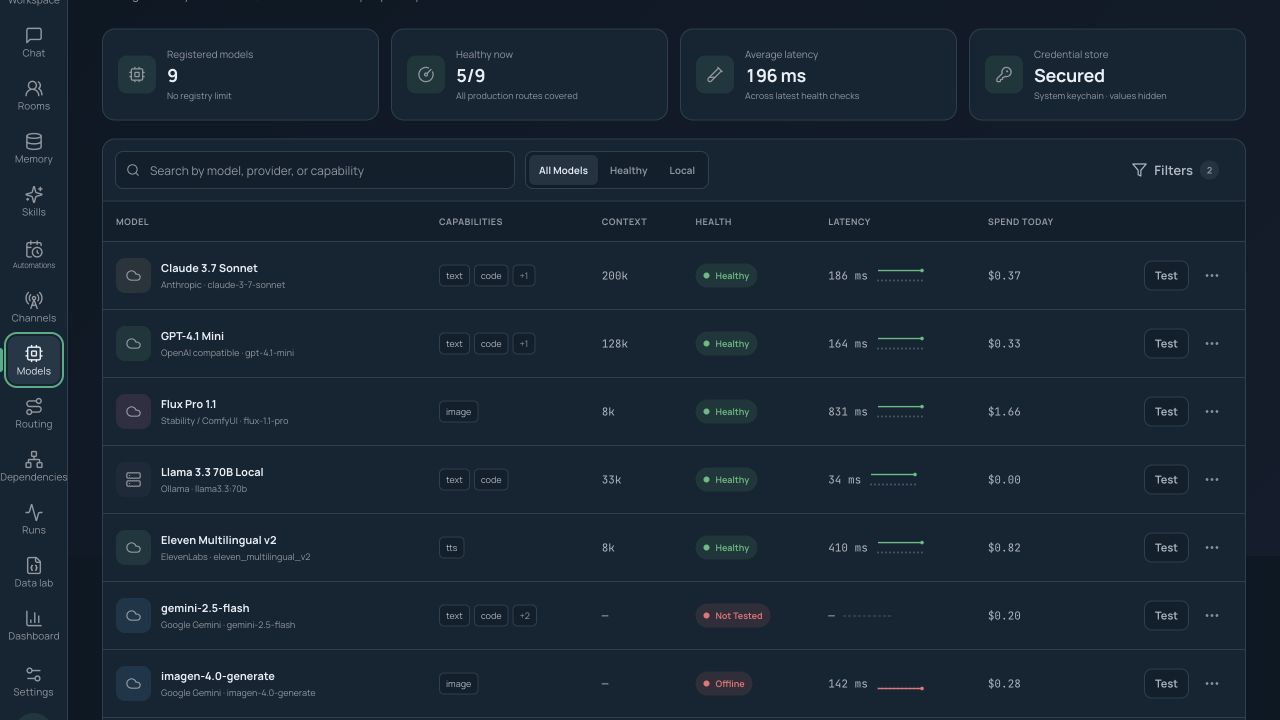
Each model entry can record:
- display name, provider, endpoint, and provider model identifier;
- one or more capabilities, such as text, code, embeddings, image, video, audio, speech-to-text, text-to-speech, reranking, or reward scoring;
- authentication reference from the credential pool;
- default generation parameters and context window;
- unit costs and rate limits used by budgets and routing;
- tags such as
local-only,eu-region, orno-PII; - enabled state and health information, including success, latency, usage, and spend.
Built-in adapters cover Anthropic, Google Gemini, Ollama, ElevenLabs, Stability/ComfyUI-style image systems, OpenAI-compatible services—including OpenAI, Azure, Groq, Together, Mistral, OpenRouter, LM Studio, and vLLM—and configurable generic HTTP providers.
Add or discover models
Choose Add model for a single entry. For compatible providers, choose model discovery to fetch the provider's catalog and bulk-register selected models. Provider-level grouping keeps a large catalog manageable. Where a provider supports it, sign in with its OAuth device or PKCE flow instead of entering a raw key.
Choose Test connection after saving. Maestro makes a minimal real call and reports a clear success, authentication, rate-limit, server, timeout, or response-format result. Duplicate a model when several configurations share an endpoint. Disabling a model preserves references but removes it from eligible routes. Deleting a referenced model first shows the workflows and routing rows that would break.
Credentials
Secrets are entered once and stored in the operating-system credential store or encrypted vault. Project files, exports, screenshots, logs, and errors carry only an opaque reference. Administrators can share a credential pool across model entries while controlling which profiles may see and spend through each entry.
Task routing
A routing matrix maps a task type to one primary model and an ordered fallback chain. Nodes can bind to a specific model or ask the active matrix to route by task type.
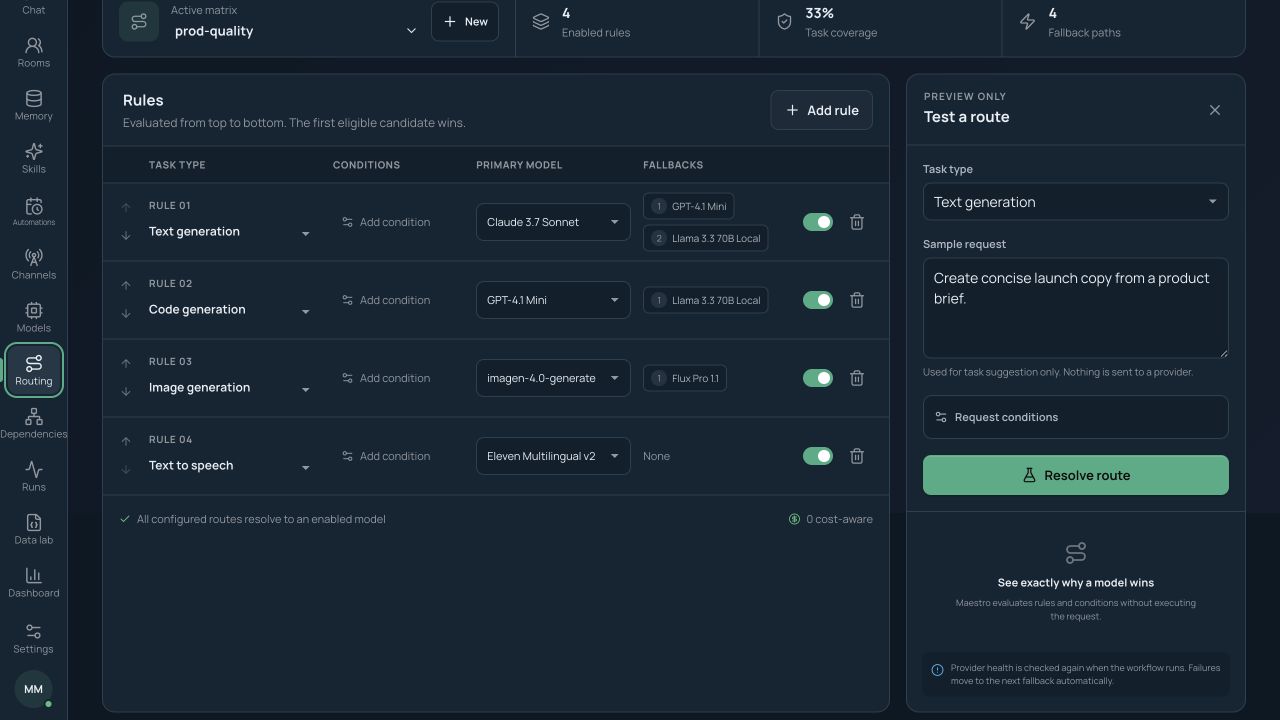
Maestro ships task rows for common text, code, image, video, audio, embedding, vision, STT, TTS, reranking, and reward operations. Media routing is a dropdown selection; no special graph is required.
Configure a routing row
- Open Routing and select or create a named matrix.
- Choose a task type.
- Select the primary model and add fallbacks in the order they should be tried.
- Add optional conditions: minimum context, maximum cost tier, required tags, present input modality, or latency class.
- If desired, enable cheapest-eligible preference.
- Save and use the preview console with a representative request.
The preview shows the matched rule, chosen model, and reason without sending a model request. During a real run, every resolution and failover is written to the event log. A timeout or eligible provider failure moves to the next configured fallback; Maestro never hides the switch.
Named matrices are project files. Select the matrix at run time when you need a production, local-only, low-cost, or experimental policy without editing the workflow.
Visual workflow authoring
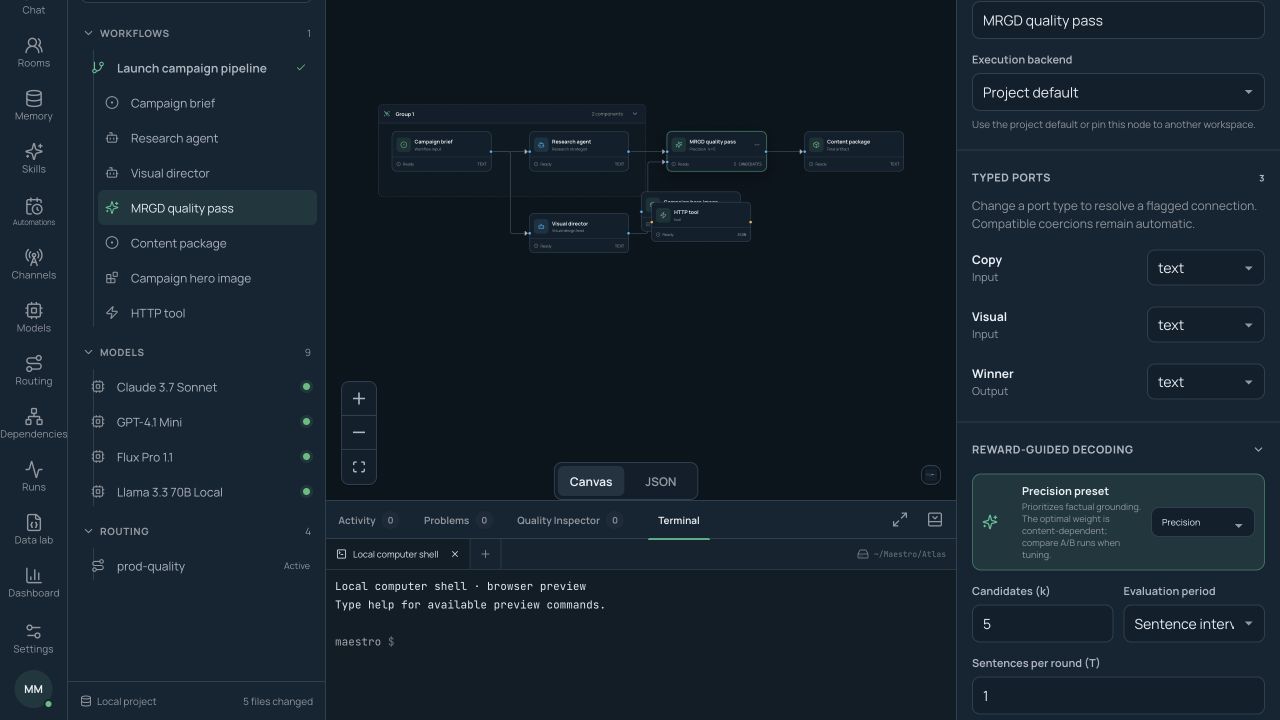
The workflow canvas is an infinite, pannable, zoomable editor. Use the component palette to drag or add nodes and connect compatible typed ports.
Component types
The palette includes Input, Output, Agent, Model Call, Router, Prompt Template, HTTP/shell/file/code/web/browser Tool, Condition/Branch, Loop/Map, Join/Merge, Human Approval, MRGD Decode, Reward Model, Memory/Vector Store, Sub-workflow, and Note. Custom manifest-and-script nodes and MCP tools can join the same palette under project policy.
Typed ports
Ports can carry text, json, image, audio, video, file, embedding, or any. Compatible coercions are applied visibly. Incompatible connections are rejected with an explanation instead of failing only after a run begins.
Select a node to edit its name, model or route binding, parameters, prompt, variable interpolation, tools, skills, backend, retry policy, approval requirement, budgets, and output behavior. Agent nodes also define a role/system prompt, autonomy level, maximum iterations, tool allowlist, and skill set.
Organize and navigate
- Multi-select nodes to move, copy, paste, or group them.
- Collapse groups to simplify large graphs; convert a stable group into a reusable sub-workflow.
- Use undo/redo for deep edit history.
- Choose Tidy workflow for automatic layout and edge routing.
- Use the minimap, fit view, zoom controls, component search, and synchronized tree to navigate.
- Use project variables for values shared by several nodes.
Validation and problems
Maestro validates while you edit. The Problems panel identifies missing fields, unresolved models or skills, type mismatches, illegal cycles, and other blockers. Selecting a problem jumps to the affected node. Dry-running an individual node with sample input is useful before committing to a long or costly workflow.
Canvas and JSON
Choose JSON in the canvas to inspect or edit the human-readable workflow representation. The visual and source forms stay synchronized, making workflows suitable for review, version control, and portable bundles.
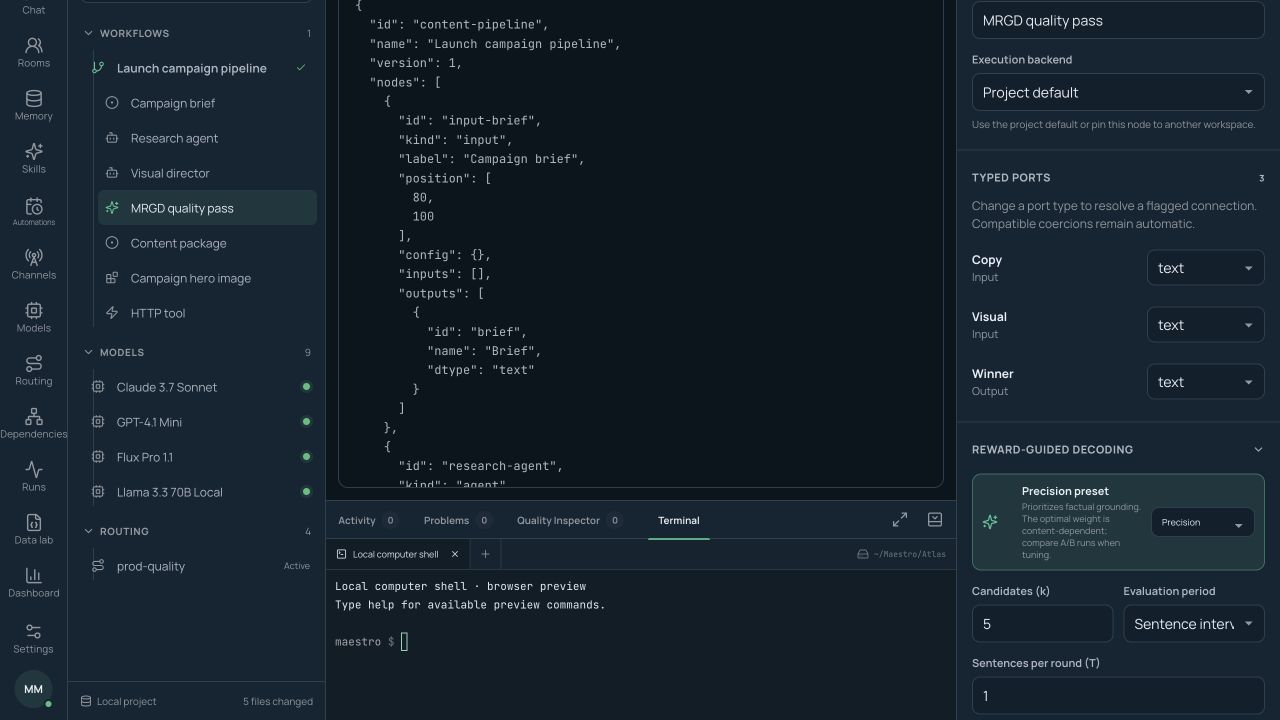
Use the diff view to compare the workflow with a previous version or review edits made during an approval. Exporting a single workflow carries its structure and non-secret references; unresolved destination references are reported during import.
Running workflows
Choose Run workflow for the full graph or run from a selected node when testing a later section. Depending on state, the run controls can pause, resume, cancel, or step through execution. Cancellation stops in-flight work consistently and records what was cancelled.
Independent branches run in parallel within the global concurrency limit and provider rate limits. Parallel agents keep independent contexts. Every tool call records its execution backend, and a node can override the project backend when policy allows.
Budgets and approvals
Set time, token, or cost budgets for a run or agent. Reaching a limit pauses safely and asks what to do; Maestro does not silently overspend. Human Approval nodes can offer Approve, Reject, or Edit, plus a timeout policy. Privileged tools can also require approval even without a dedicated approval node.
Retries and error policy
Nodes can retry with backoff and use a per-node error policy. Routed model calls follow their configured fallback chain. Every retry, failure, and route change appears in the run log and timeline.
Artifacts and event history
Run outputs—including files, images, audio, screenshots, and reports—are stored as artifacts. The persistent event log records prompts, responses, streamed output, tool arguments and results, route decisions, approvals, reward scores, external endpoints, payload sizes, time, tokens, and cost. Sensitive values are redacted.
Multimodal Reward-Guided Decoding (MRGD)
MRGD improves a generation by sampling several candidates, scoring them, and selecting or continuing the best. Enable it with an MRGD Decode node or on a compatible generation node.
Configure:
- Candidates (k): 1–30; five is the standard starting point.
- Evaluation period: every T complete sentences or once for the whole response.
- Temperature: inherited from the model unless overridden.
- Maximum rounds: a safety bound for sentence-level decoding.
- Reward scorers and weights: adjustable at run time without retraining.
- Scorer failure policy: skip and renormalize, or fail the round.
Project presets include Precision, Balanced, and Recall. Precision emphasizes hallucination resistance; Recall emphasizes source-object coverage; Balanced divides weight between them. The right choice depends on the content, so compare real outputs rather than treating one preset as universally best.
Scorers can be learned multimodal reward endpoints, programmatic object-recall scorers, rubric-based LLM judges, or custom JSON-in/score-out scripts. Multimodal scorers receive the source context—such as an image—alongside candidates.
The node inspector estimates generation cost before the run. The Quality inspector then shows each round's candidates, per-scorer scores, combined score, and selected continuation. Actual generation and scorer costs are recorded after completion. Media outputs use whole-artifact best-of-k, explicitly labeled as Maestro's extension of sentence-level MRGD.
For a controlled comparison, run the same node with MRGD off and on, or compare two presets. The run comparison view can line up duration, cost, routes, and reward scores.
Dependencies and live activity
Open Dependencies to see how workflows, sub-workflows, nodes, models, providers, agents, and skills relate. Pivot by workflow, model, provider, or task type to answer questions such as “what will break if this model is removed?”
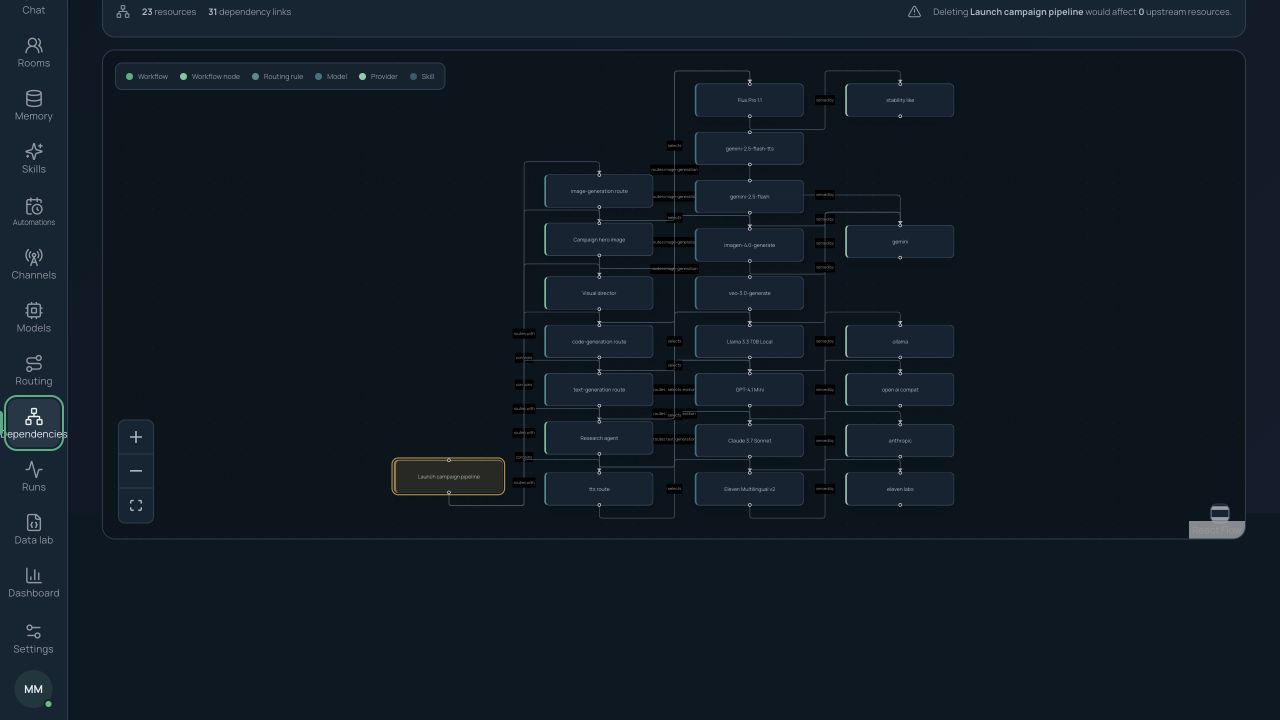
During a run, active nodes and edges show execution flow. Agent badges show idle, thinking, calling-model, waiting-on-tool, waiting-on-human, blocked, failed, or done state. The agent list includes current node, elapsed time, tokens, and cost; selecting an agent jumps to its node and transcript.
The run timeline shows start/end time, parallel work, retries, failovers, and approval pauses. Timeline items open their node inputs and outputs. Dependency visuals can be exported to PNG or SVG for reports.
Run history, replay, and analytics
Open Runs to filter completed, failed, cancelled, paused, and active runs. A run can be replayed event by event, including model output, tool activity, routing, approvals, artifacts, and MRGD decisions. Run comparison is available for repeated executions of the same workflow.
The Dashboard summarizes spend, token or media usage, run and session counts, success, duration, provider/model distribution, task types, input/output tokens, estimated cost per session, cache hit rate where reported, and 30-day trends.
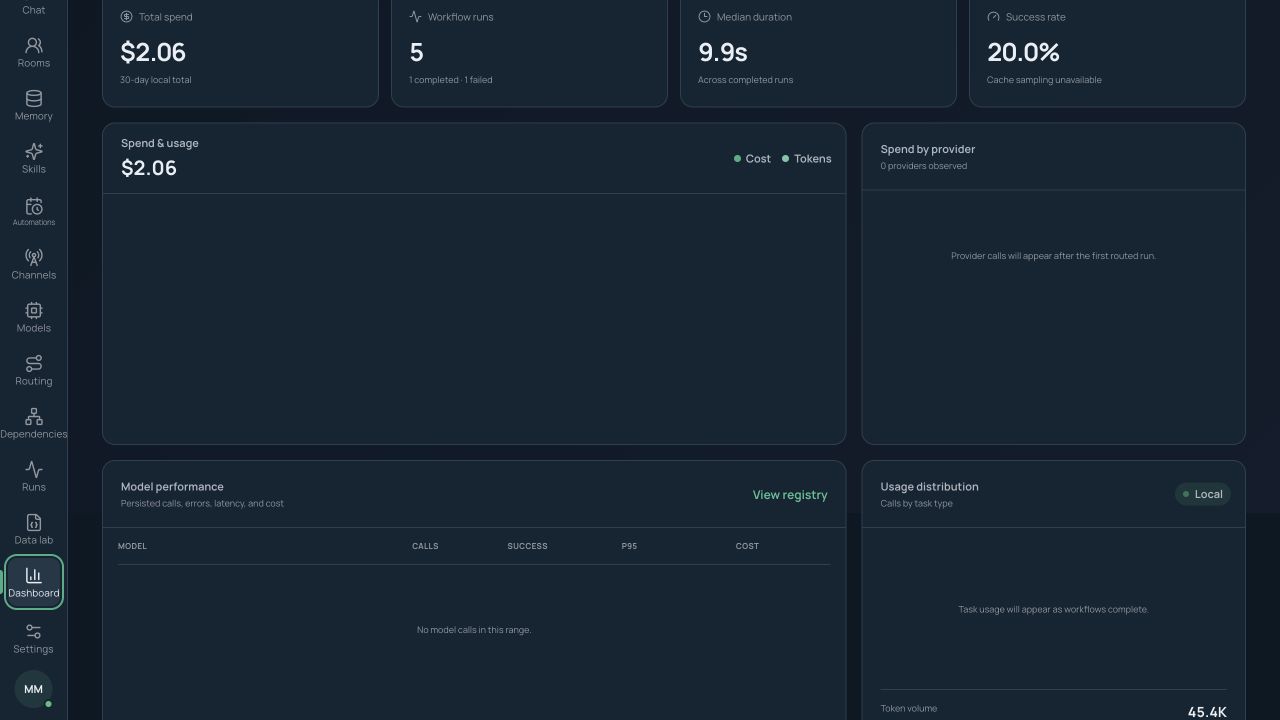
Alerts can watch cost, error rate, or latency thresholds and deliver an in-app notification or connected channel message. The runtime monitor adds CPU, memory, queue depth, active sessions/runs, and backend health. OpenTelemetry trace export is available for deployments that need external observability.
Built-in editor and terminal
Text editors provide syntax highlighting for JSON, YAML, Markdown, Python, JavaScript/TypeScript, and Rust files used by workflows, prompts, scorer scripts, and skills.
The bottom Terminal tab can host multiple named sessions attached to the local computer or another configured backend. Create, switch, and close sessions without leaving the workflow.